| |
|
ISAM Toolbar Link |
 |
The Results Graphs page also presents two selection
boxes, one for the available simulation results and one for types of graphs that can be created.
You can graph individual variable for both one or multiple model runs. To compare a
variable between model runs, select multiple model runs and 1 or more variables. To
make a simpler graph, choose one model run and one or more variables. (Depending
on browser and OS, the user may need to press the <CTRL> key while clicking
with the mouse in order to select multiple options from the list.)
Once the proper selections have been made, users can then click the Get Results
button at the bottom of the page.
A new page then appears with a series of buttons corresponding to each output variable.
Clicking any of these buttons will generate a graph of that particular result in a new window.
If more than one simulation was selected, more than one line will be plotted.
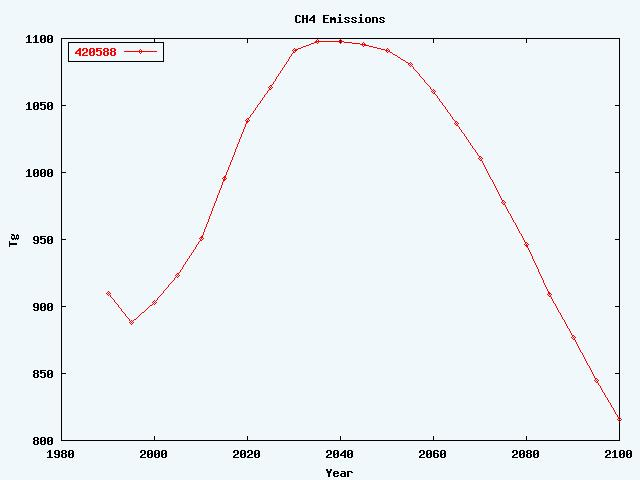
One Run: Click image to enlarge
|
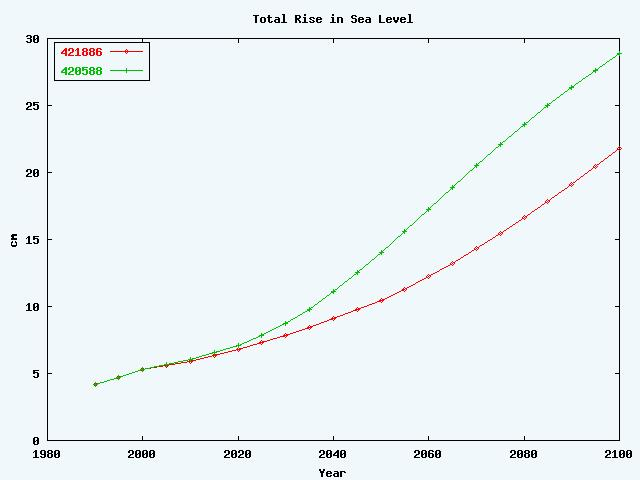
Two Runs: Click image to enlarge |
|